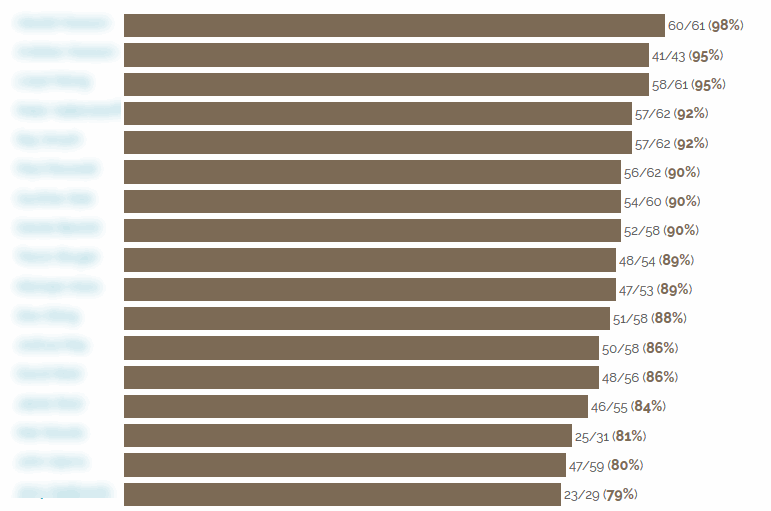
Making Music Platform can also graph all your attendance data. The data can be analysed...
- By event - see what your best-attended events were
- By member - see who are your best - and worst - attenders
You can show the graphs by...
- The percentage attendance (e.g. 60 out of 80 attendances = 75%)
- The actual number of attendances (e.g. 60 out of 80 attendances = 75%)
- The total possible number of attendances (e.g. 60 out of 80 attendances = 75%)
An example is below, showing the members, sorted by percentage attendance (best attenders at the top)...


